Maps have always told stories. They show us where we are and where we have been, and they hint at what is to come. The maps of America we use today, with their fixed state lines and familiar coastlines, feel permanent. But what if they are not? The future maps of America will be dynamic, living documents that change as our environment, technology, and society evolve. This is not about states suddenly breaking apart, but about a quieter, slower redrawing driven by powerful forces. Getting a glimpse of these future maps of America offers a thrilling look at the next chapter of the American story, one where geography is no longer destiny but a conversation.
Why Our Maps Are Doomed to Change
Think of a map as a snapshot in time. The current borders of the United States were drawn based on rivers, mountain ranges, and political deals made centuries ago. But the world is not static. The most significant driver of change is our climate. Rising sea levels, intense droughts, and powerful storms are actively reshaping the physical landscape. At the same time, technology is collapsing distances, allowing people to live and work in new ways. Social trends are also shifting the way and where we build our communities. These powerful forces combined mean that the static paper map is becoming a relic. The future maps of America will need to be updated constantly to reflect our changing reality.
The Climate Crisis: Redrawing the Coastlines
One of the most dramatic changes to America’s future maps will occur along the coasts. As global temperatures rise, polar ice melts and seawater expands, raising sea levels. Government agencies, such as NASA’s Sea Level Change Team (external link), provide more precise data on this trend. This means low-lying areas are at risk. Cities like Miami, New Orleans, and parts of the Chesapeake Bay region could see significant portions of their land become permanently flooded. Future maps might show new inlets where neighborhoods once stood, and coastlines pushed further inland. This is not science fiction; it is a process already beginning, and it will force us to rethink what the edge of our continent truly looks like.
The Great American Migration: A Shift In Population
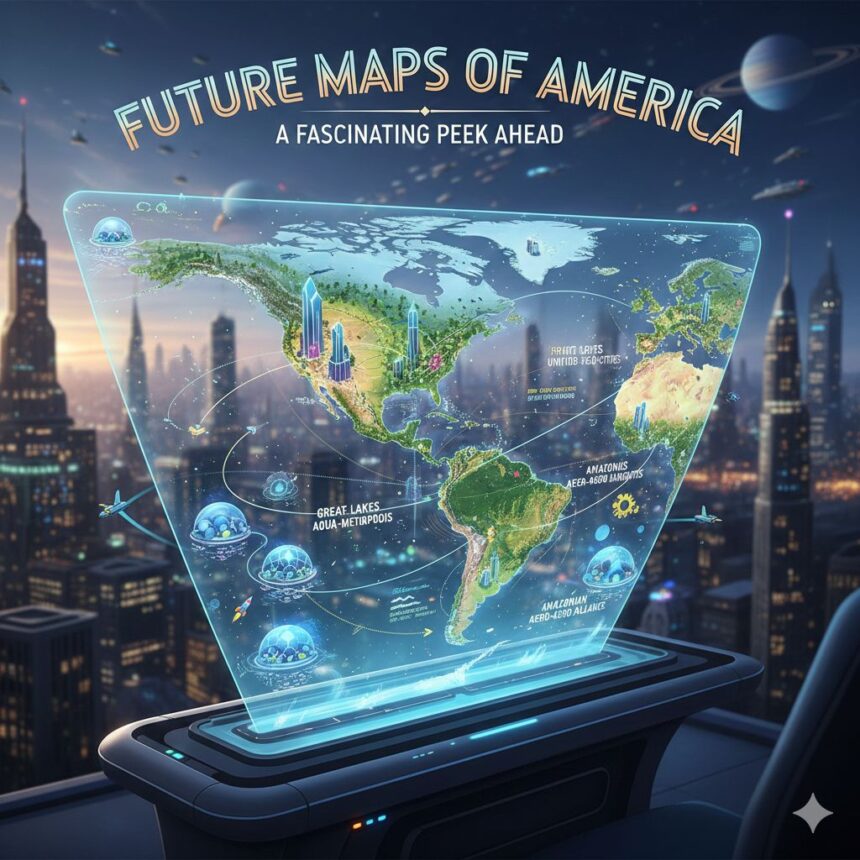
As the climate changes, it will influence where people choose to live. We are already seeing a trend of people moving away from areas with high climate risk, such as the arid Southwest, which faces water shortages, and towards regions with more stable conditions. This movement will reshape the population density you see on future maps of America. The “Sun Belt” might see a slowdown in growth, while the “Great Lakes” region, with its abundant freshwater, could become a new hub. These future maps of America will tell a story of adaptation, showing bustling new cities in previously quiet areas and the gradual quieting of places that can no longer support large populations.
Key Features of Tomorrow’s Maps
The maps of tomorrow will be fundamentally different from the ones we use today. They will not just be printed on paper; they will be interactive digital tools.
-
Real-Time Data: They will display live information, including traffic and weather, as well as air quality and population density.
-
Layered Information: You can toggle layers on and off to view the traditional street map, then add a layer for climate risk or historical data.
-
Predictive Modeling: Advanced maps will forecast future conditions, showing projected sea-level rise in 50 years or population growth trends.
-
3D and Immersive Views: Navigating a city might involve a 3D model you can explore, giving a much clearer sense of place than a flat, 2D image.
Technology’s Role: The Smart Map Revolution
Technology is the brush that will paint the future maps of America. We are moving beyond simple GPS navigation. The next generation of maps will be built by artificial intelligence that analyzes satellite imagery to automatically update changes. The Internet of Things, with its network of connected sensors, will feed constant data about infrastructure and the environment into these maps. Imagine a map that shows not just roads, but also the flow of energy across a smart grid, or the availability of electric vehicle charging stations in real-time. These smart maps will become essential tools for city planners, emergency responders, and everyday citizens, making our world more efficient and understandable.
Comparing Maps: Then, Now, and Tomorrow
It is helpful to see how the purpose and nature of maps have evolved.
| Feature | Past Maps (Paper) | Present Maps (Digital) | Future Maps of America (Intelligent) |
|---|---|---|---|
| Format | Static, printed on paper | Interactive, on devices | Dynamic, multi-layered, and immersive |
| Key Info | Roads, cities, and physical features | Real-time traffic, points of interest | Predictive analytics, climate data, live resource levels |
| Updates | Years or decades | Weekly or monthly | Constant, real-time |
| Primary User | General public, travelers | General public, drivers | Everyone, plus AI systems and city infrastructure |
This table shows a clear evolution from a simple reference tool to an active, intelligent partner in navigating life.
Economic Highways: The Changing Flow of Trade
The economic map of America is also in for a shift. Traditional manufacturing hubs have changed, and the digital economy allows businesses to thrive almost anywhere. However, new physical infrastructure will also create new commercial corridors. The future maps of America might highlight new high-speed rail lines connecting major cities, reducing travel time and making new “commuter belts.” They could also show updated port facilities built to handle the new trade routes opened by melting Arctic ice. The flow of money and goods will literally redraw the map of economic importance, creating new boomtowns and revitalizing regions that were once left behind.
The Rise of the Megaregion
Look at a current map of the United States, and you see distinct cities. Now, imagine those cities growing so much that they start to blend into each other. This is the concept of the megaregion. For example, the area from Boston to Washington D.C., often called “BosWash,” could become one continuous, interconnected urban corridor. Future maps of America may show these megaregions as single, colored zones rather than a collection of separate cities. These areas would share economies, infrastructure, and resources, functioning as powerful, unified entities on the national and global stage.
Key Takeaways for the Curious Mind
What does all this mean for you? Here are the main points to remember.
-
Maps are not permanent. They are a reflection of their time, and our time is one of rapid change.
-
Climate is a primary mapmaker. Coastal changes and water scarcity will directly influence where people can live.
-
Technology will make maps alive. They will be interactive tools filled with real-time, valuable data.
-
Society shapes geography. Where we choose to live and build will define the next version of our national map.
Conclusion: The Map as a Living Story
The future maps of America are being drawn not by cartographers with pens, but by the collective actions of humanity and the powerful forces of nature. They will tell a living story of adaptation, innovation, and challenge. By understanding the forces that shape these future maps of America, we can better prepare for the world to come. It is a reminder that our land is not just a place we inhabit, but a partner in an ongoing, dynamic relationship. The next time you look at a map, see it not as a finished product, but as one frame in a long and fascinating movie that is still playing out.
Frequently Asked Questions
Q: Will the state borders actually change?
A: It is doubtful that official state borders will change for a long time due to the immense political complexity. The changes will focus more on population density, economic activity, and physical geography than on redrawing political lines.
Q: How accurate are these predictions?
A: While we cannot predict the exact details, the trends in climate science and technology are apparent. Organizations like the U.S. Geological Survey (external link) study these changes extensively. The general direction of change is well-supported by data, even if the precise outcomes are not.
Q: Where can I learn more about mapping and geography?
A: You can find more fascinating discussions about technology and society on websites like InspirationFeed, which explores how our world is transforming.